A sales pipeline worth $2 million sounds impressive.
But what if only 8% of those opportunities actually become customers?
Pipeline value is one of the first metrics sales leaders look at, but on its own, it tells only part of the story. A healthy pipeline isn't just about how much revenue is sitting in your CRM—it's about how much of that revenue is realistically expected to close.
To understand the true health of your sales pipeline, you need to evaluate pipeline value and win rate together.
Pipeline Value Isn't Revenue
Pipeline value represents the total potential revenue from all open opportunities.
For example:
- 20 deals worth $10,000 each
- 15 deals worth $25,000 each
- 5 enterprise opportunities worth $100,000 each
Together, these opportunities create a large pipeline value.
However, until deals are won, none of that revenue is guaranteed.
A large pipeline can create a false sense of confidence if deal quality is poor.
What Is Win Rate?
Win rate measures how many qualified opportunities successfully become customers.
The basic formula is:
Win Rate = (Won Deals ÷ Closed Opportunities) × 100
For example:
- Closed Opportunities: 100
- Won Deals: 30
Win Rate = 30%
Unlike pipeline value, win rate reflects execution.
It tells you how effectively your sales process converts opportunities into revenue.
Why Pipeline Value Alone Can Be Misleading
Many businesses celebrate growing pipeline numbers while ignoring declining conversion performance.
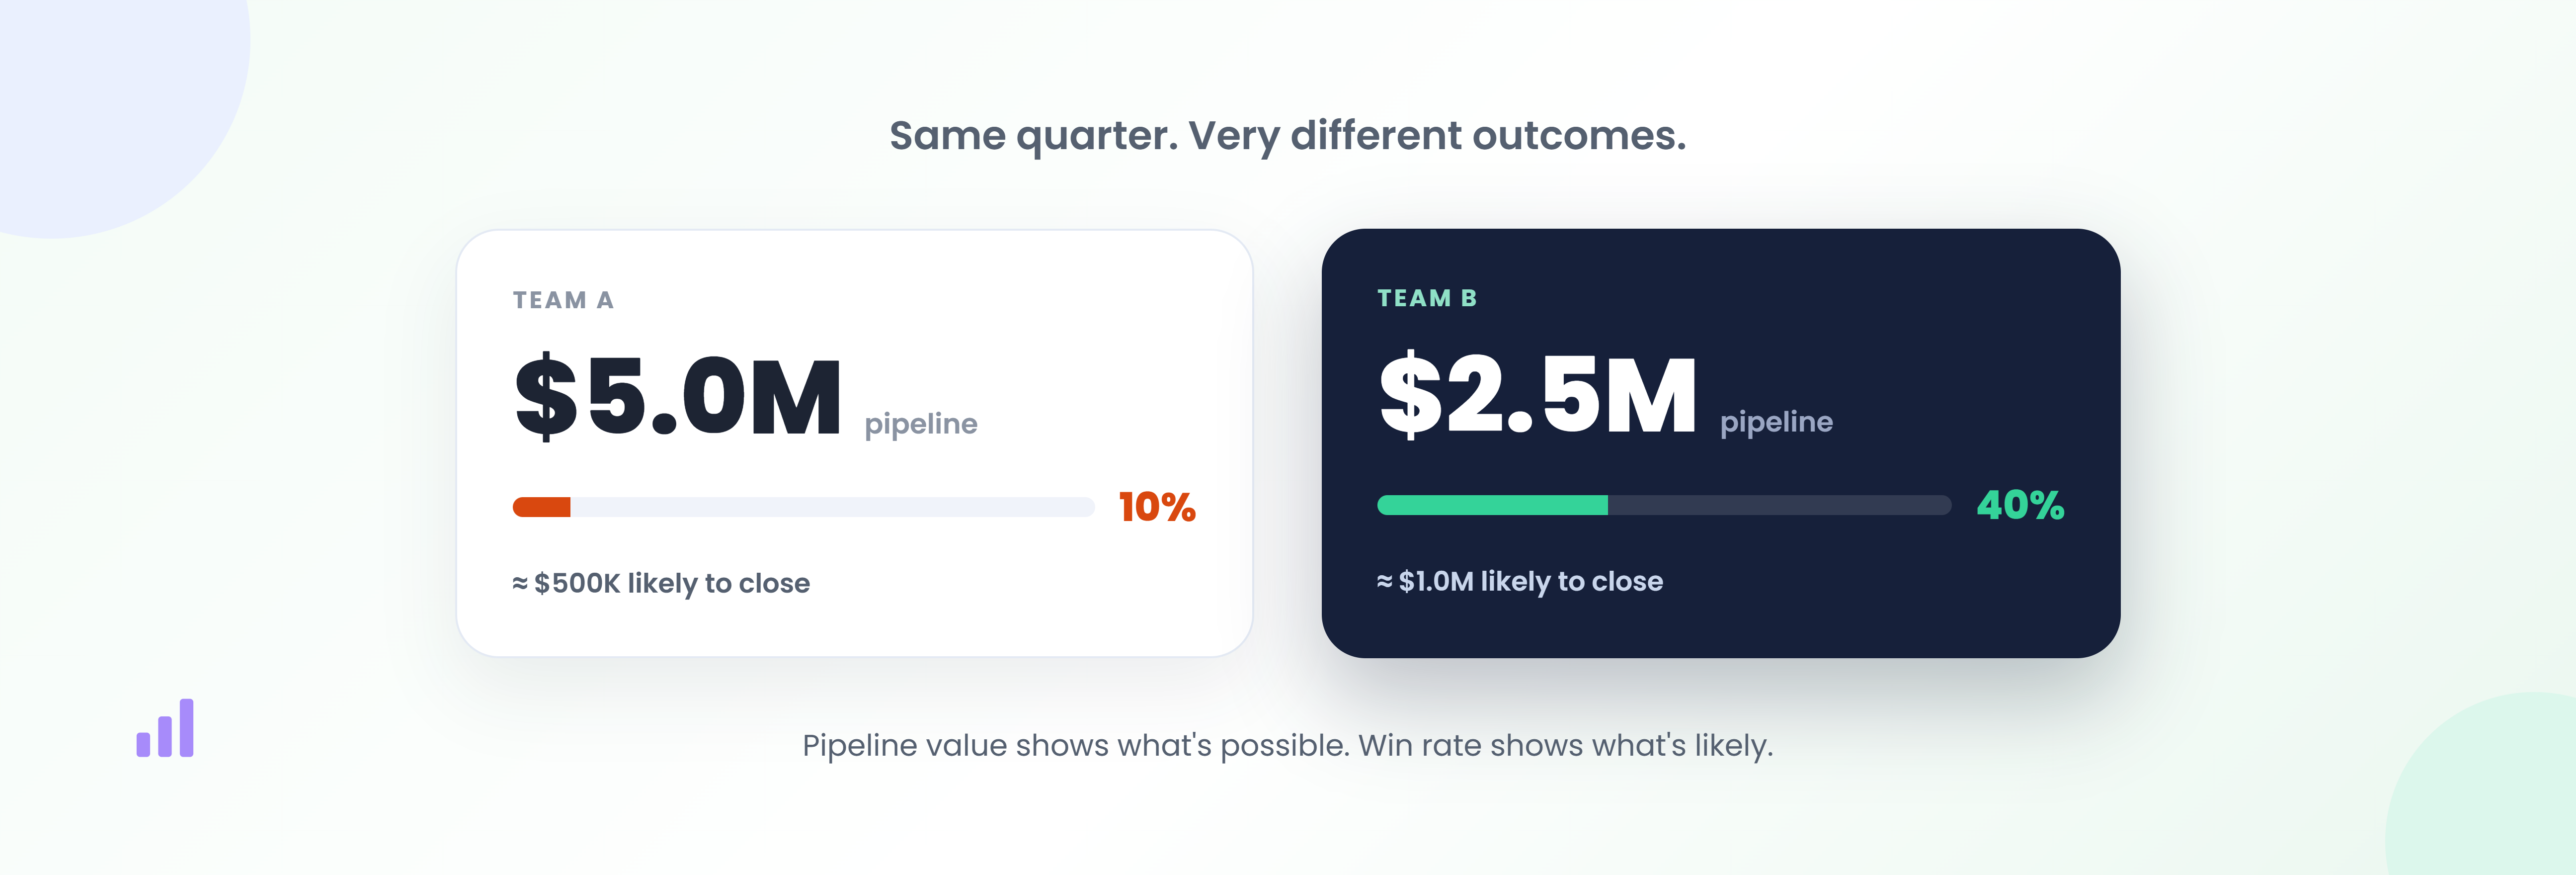
Imagine these two sales teams:
TeamPipeline ValueWin RateTeam A$5,000,00010%Team B$2,500,00040%
Although Team A has the larger pipeline, Team B is likely to generate more predictable revenue because they consistently convert a higher percentage of opportunities.
More pipeline doesn't always mean more sales.
Pipeline Quality Matters More Than Pipeline Size
An oversized pipeline often contains:
- Stale opportunities
- Unqualified prospects
- Duplicate deals
- Inactive buyers
- Opportunities with little chance of closing
These inflate revenue forecasts while making sales reports less reliable.
A smaller pipeline filled with qualified opportunities is often healthier than a massive pipeline with poor conversion potential.
Read Both Metrics Together
The most effective sales leaders evaluate both metrics simultaneously.
Ask questions like:
- Is pipeline value increasing?
- Is win rate improving or declining?
- Which stages have the lowest conversion?
- Are enterprise deals closing at the same rate as smaller deals?
- Which lead sources produce the highest win rates?
Looking at both metrics together provides a much clearer picture of sales performance.
Why Win Rate Changes
Several factors influence win rate, including:
Lead Quality
Higher-quality leads naturally convert more frequently than poorly targeted prospects.
Sales Process
Long approval cycles, inconsistent follow-ups, or unclear proposals reduce conversion rates.
Competition
Competitive markets often require stronger differentiation and better customer engagement.
Pricing
Pricing that doesn't match perceived value can reduce close rates.
Sales Enablement
Well-trained representatives equipped with the right tools and information consistently perform better.
Improve Your Pipeline, Not Just Its Size
Growing revenue isn't always about generating more opportunities.
Sometimes it's about improving the quality of the opportunities already in your pipeline.
Focus on:
- Better lead qualification
- Faster first response times
- Consistent follow-ups
- Removing inactive deals
- Improving proposal quality
- Tracking reasons for lost opportunities
Small improvements in win rate often produce greater revenue growth than simply adding more leads.
Forecast Revenue More Accurately
Sales forecasting becomes more reliable when pipeline value is combined with historical win rates.
Instead of assuming every opportunity will close, businesses can estimate expected revenue based on actual performance.
This leads to:
- More accurate forecasts
- Better resource planning
- Smarter hiring decisions
- Improved financial planning
- Greater confidence across leadership teams
Forecasts built on realistic conversion rates are far more valuable than forecasts based on pipeline size alone.
Build a Healthier Sales Pipeline
Healthy pipelines are characterized by:
- Qualified opportunities
- Consistent activity
- Realistic deal values
- Strong follow-up discipline
- High conversion rates
- Regular pipeline reviews
The objective isn't to make your pipeline look bigger—it's to make it more predictable.
Final Thoughts
Pipeline value tells you how much business is possible.
Win rate tells you how much business is likely.
Neither metric should be viewed in isolation.
By monitoring both together, sales leaders gain a more accurate understanding of pipeline health, improve forecasting accuracy, and identify opportunities to strengthen their sales process.
The strongest sales organizations don't just build larger pipelines—they build pipelines that consistently convert.